Big data comparison of quantum invariants
An interactive big-data comparison of quantum knot invariants: not just whether they distinguish knots, but how they compare to each other.
Data
- Title: Big data comparison of quantum invariants
- Authors: Daniel Tubbenhauer and Victor L. Zhang
- Status: To appear in Journal of Experimental Mathematics. Last update: Wed, 5 Feb 2025 03:03:57 UTC
- Code and (possibly empty) Erratum: Click and Click
- ArXiv link: https://arxiv.org/abs/2503.15810
- LaTex Beamer presentation: Slides1, Slides2
Abstract
We apply big data techniques, including exploratory and topological data analysis, to investigate quantum invariants. More precisely, our study explores the Jones polynomial's structural properties and contrasts its behavior under four principal methods of enhancement: coloring, rank increase, categorification, and leaving the realm of Lie algebras.
What is the point?
Quantum invariants are usually sold as tools for distinguishing knots. This paper asks a more empirical question: how do the standard upgrades of the Jones polynomial compare in practice? The answer is explored through datasets, visualization and topological data analysis.
Large tables of quantum invariants for knots.
Coloring, rank increase, categorification and other enhancements.
The invariant landscape has structure, not just success and failure rates.
Talks and videos
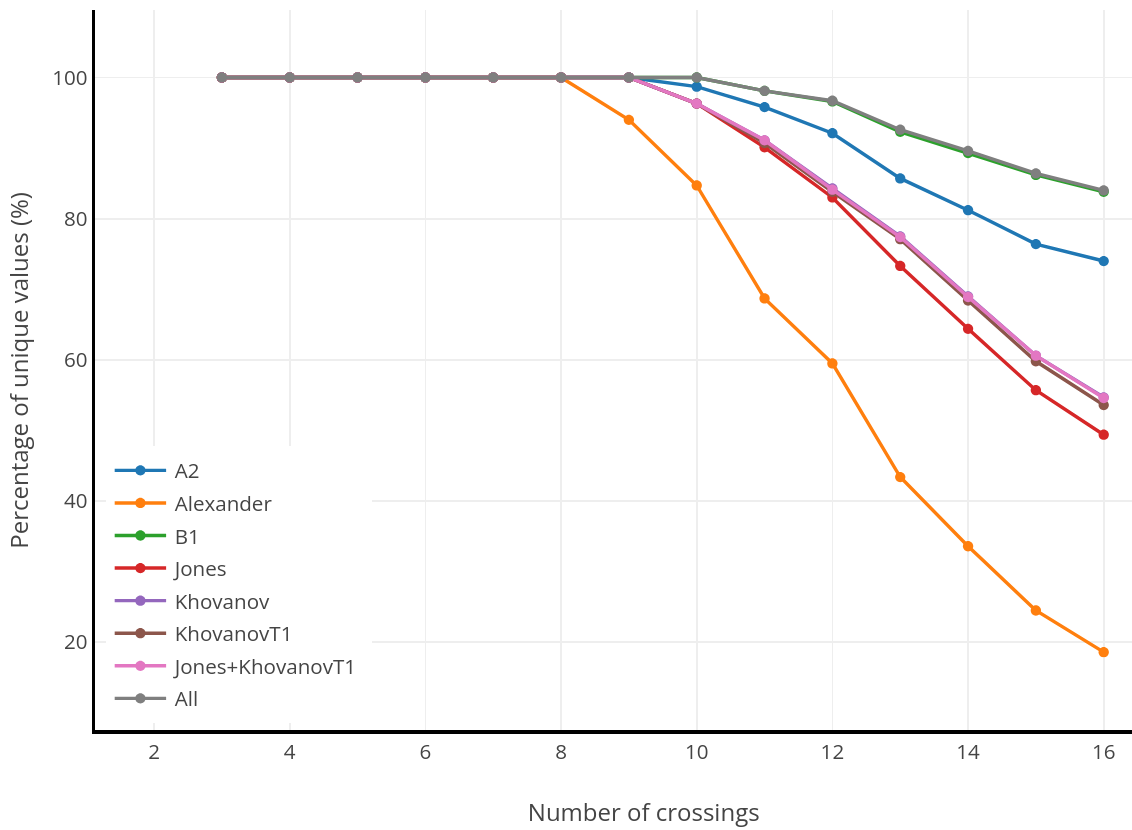
A picture
One of the invariant-comparison plots from the interactive companion site.
A few extra words
The Jones polynomial is widely recognized as one of the most significant knot invariants of the twentieth century, and Jones' groundbreaking discovery uncovered profound and unexpected connections between diverse areas of mathematics and physics. The Jones polynomial serves as the foundation of a larger family of knot invariants derived from quantum groups, known as (Witten)--Reshetikhin--Turaev invariants. These invariants also have categorified counterparts, positioning them as remarkable objects at the intersection of multiple mathematical fields.
This paper is essentially interactive, which can be accessed by clicking on the links above. It is one of the comparisons we do.